
Fuel cards deliver the fastest return on fleet fueling investments, typically breaking even within 2 to 3 months by closing fraud and purchase-control gaps. Telematics paired with driver coaching produces the deepest, most durable savings, often 15 to 25% within a year, while idle-reduction equipment pays back quickly for high-idling vehicles. This guide walks through the formula, the inputs to collect, a worked example, and how to pilot before you commit budget.
TL;DR:
- Fuel cards repay in 2 to 3 months with low single digit savings; telematics and coaching can cut fuel use 15% to 25% within a year.
- Build the baseline from a full season of class specific MPG, miles, fuel spend, idle time, labor, and maintenance, and reconcile mileage sources to avoid inflated savings.
- Pilot 15% to 20% of comparable vehicles against an unchanged control group, using consistent measures and enough time to account for seasonal swings.
- Idle reduction can pay back quickly for vehicles near 2,000 annual idle hours, especially when diesel costs more than about $2 per gallon.
Table of Contents
- The ROI Formula and the Baseline Data You Must Collect
- Step-by-Step Worked Example: Calculate Fleet Fueling ROI for a Sample Fleet
- High-Impact Savings Levers: What to Prioritize and Expected Ranges
- Tools and Calculators: What Inputs Matter and How to Use Them
- Designing and Running a Pilot to Prove Fuel ROI
- Building the Business Case and Sensitivity Analysis for Executives
- Operationalizing Fueling Savings: How Anytime Fuel Pros Fits Into ROI Programs
- Strategies to Improve Fuel Purchasing Terms or Contract Negotiation to Enhance ROI
- Impact of Fuel Quality and Supplier Reliability on ROI
- Regulatory and Compliance Considerations Affecting Fleet Fueling Costs and ROI
- Request a Pilot Quote or ROI Template From Anytime Fuel Pros
- FAQ
- Sources
The ROI Formula and the Baseline Data You Must Collect
The hard part is not the math, it is defining net benefits correctly so you are not crediting a program for savings it did not cause.
Net benefits break into four buckets. Fuel savings come from reduced gallons burned per mile or per hour. Labor recovered comes from fewer hours spent driving to retail stations or chasing fuel receipts. Maintenance avoided comes from better engine run patterns and fewer theft-related repairs, aided by using refurbished starters for fleet maintenance that meet OEM specifications. Theft reduction comes from tighter purchase controls and site-level fuel accounting.
Before modeling any of this, pull your baseline numbers. Without a clean starting point, every savings claim becomes guesswork.
- Current annual fuel spend, broken out by diesel and gasoline where applicable
- Fleet MPG by vehicle class, measured over at least one full season
- Annual miles driven per vehicle and total fleet miles
- Idling hours per vehicle per year, pulled from telematics where available
- Labor hours spent on refueling trips, including drive time and wait time
- Maintenance spend tied to fuel systems and engine wear
The biggest accuracy risk is double-counting. If your fuel card data and your telematics platform both report mileage, reconcile them before building a model, because stacking two sources of the same metric inflates your denominator or your savings estimate. NACFE’s analysis treats fuel as fundamentally a data problem: unifying fuel card, telematics, maintenance, and payroll records into one view is what turns fuzzy assumptions into traceable, collectible dollars. Fleets that skip this step tend to overstate savings in year one and underdeliver by year two.
Step-by-Step Worked Example: Calculate Fleet Fueling ROI for a Sample Fleet
Here is a reproducible model you can adapt with your own numbers. Assume a 40-vehicle fleet of pickups and medium-duty trucks running 1,800 miles per vehicle per month, baseline MPG of 9.5, and diesel priced at $3.80 per gallon. The fleet is piloting a combined fuel-card and telematics program with driver coaching.
- Calculate baseline monthly fuel cost: 40 vehicles × 1,800 miles ÷ 9.5 MPG × $3.80/gallon equals $28,800 per month, or $345,600 per year.
- Estimate the investment: telematics hardware and installation at $350 per vehicle (one-time, $14,000 total) plus a $12 per vehicle monthly subscription ($480/month, or $5,760/year), plus fuel card fees of roughly $3 per vehicle per month ($120/month, or $1,440/year).
- Apply a conservative 15% fuel savings from coaching and routing, consistent with the low end of documented case-study ranges: $345,600 × 15% equals $51,840 in annual fuel savings.
- Add labor recovered: fewer off-site fueling trips save an estimated 2 hours per vehicle per month at $28/hour fully loaded, or $26,880 annually.
- Sum total first-year benefit: $51,840 + $26,880 equals $78,720, against a first-year investment of $14,000 + $5,760 + $1,440 equals $21,200.
| Period | Investment | Fuel savings | Labor savings | Net cash flow | Cumulative |
|---|---|---|---|---|---|
| Month 1 | $14,000 | $4,320 | $2,240 | ($7,440) | ($7,440) |
| Month 3 | $600 | $4,320 | $2,240 | $5,960 | $4,480 |
| Month 6 | $600 | $4,320 | $2,240 | $5,960 | $22,660 |
| Year 1 total | $21,200 | $51,840 | $26,880 | $57,520 | $57,520 |
| Year 3 total (cumulative) | $25,960 | $155,520 | $80,640 | $210,200 | $210,200 |
These figures are illustrative: plug in your own fleet size, fuel price, and labor rate before presenting a number to leadership.
High-Impact Savings Levers: What to Prioritize and Expected Ranges
Not every lever deserves equal attention. Rank them by speed of payback first, then by depth of savings, and you will usually land on a sequence that funds itself.
- Fuel cards prevent unauthorized purchases and give purchase-level visibility; payback typically runs 2 to 3 months with savings in the low single-digit percent of total fuel spend, and our fuel theft action plan covers the policy side.
- Telematics plus driver coaching delivers the deepest savings, 15 to 25% over 12 months, though it carries higher upfront cost and a longer ramp before drivers adjust behavior.
- Idle reduction (auxiliary power units, battery APUs, or engine shutoff systems) pays back fast for high-idling vehicles, loosely defined as around 2,000 idle hours per year when diesel runs above roughly $2 per gallon.
- Route optimization, tire programs, and aerodynamic upgrades produce smaller individual gains but typically pay back in 12 to 24 months and stack well with other measures.
A municipal police fleet study found idle reduction saved about 345 gallons per vehicle per year, roughly $811 in operating cost per vehicle, with payback under a year in that high-idling use case.
Driver behavior deserves its own line item. Aggressive driving can cut fuel economy by 10 to 40% depending on duty cycle, and coaching paired with real-time feedback tends to outperform feedback alone by a meaningful margin. No single lever gets you to the 20 to 30% range that layered programs achieve. Fuel cards catch the leaks, telematics and coaching change behavior, and idle reduction removes the waste that behavior alone cannot fix. Our seasonal fuel-efficiency guide covers maintenance items that complement these levers as temperatures shift.
Tools and Calculators: What Inputs Matter and How to Use Them
A fuel ROI calculator is only as good as the inputs you feed it, and most vendor tools hide weak assumptions behind a clean interface.
- Fleet size and annual miles set the scale of every other calculation.
- Baseline MPG by vehicle class determines how much room exists for improvement.
- Unit fuel cost should reflect your actual delivered price, not a national average.
- Idling hours flag which vehicles qualify for idle-reduction payback.
- Subscription fees and upfront hardware costs need to include installation labor, not just unit price.
Run a simple sensitivity check before trusting any single output. Model your payback at current fuel price, then at 15% higher and 15% lower, since DOE’s FEMP guidance recommends fleet-specific inputs over fixed industry averages precisely because fuel price swings change the math fast. Do the same for asset life: a telematics contract that pays back at 18 months looks very different if your vehicle turnover is 24 months versus 60 months.
Pro Tip: Before accepting a vendor’s ROI claim, ask for their raw baseline data, the exact measurement period, and how they attribute savings to their product versus other changes happening on your fleet at the same time.
Designing and Running a Pilot to Prove Fuel ROI
A pilot is cheaper than a fleet-wide rollout that underperforms, and it gives you real numbers instead of vendor projections.
- Select a representative subset: 15 to 20% of your fleet across similar routes and vehicle types, with a matched control group running unchanged.
- Set pilot duration to one full billing cycle plus, where possible, a full seasonal cycle, since recommended pilot design calls for rotating A/B groups across comparable conditions rather than a single snapshot month.
- Lock your measurement plan before day one: pre- / post-fuel spend, MPG, idling hours, and labor hours, pulled from the same systems you will use post-launch.
- Baseline fuel price to the same period used for measurement, so a price swing does not get mistaken for a program effect.
- Define success criteria in writing: a specific percent savings target, a payback window, and a minimum confidence threshold before scaling.
- Report on a fixed cadence, monthly at minimum, using a one-page executive summary that shows baseline versus actual, not just a final percentage.
Seasonality distorts short pilots more than most managers expect. A six-week pilot that spans a holiday slowdown or a weather event will show numbers that will not hold once volume normalizes, so build in enough time to average out the noise.
Building the Business Case and Sensitivity Analysis for Executives
Executives rarely need the full model, they need three numbers presented cleanly: payback period, net present value, and ROI, framed across conservative, base, and aggressive scenarios.
- Conservative scenario: assume the low end of your savings range and a slower adoption curve, useful for setting a floor executives can trust.
- Base scenario: use your actual pilot results or the midpoint of documented ranges.
- Aggressive scenario: use the high end of comparable case studies, labeled clearly as a ceiling, not a promise.
Layered fuel programs that combine cards, telematics, and coaching consistently outperform any single intervention measured alone, according to comparative ROI analysis.
Run sensitivity on two variables executives always ask about: fuel price and adoption rate. Show both on one simple chart rather than a dense spreadsheet. Anticipate the predictable questions: recurring subscription fees belong in the denominator every year, not just year one; scalability depends on whether hardware and training costs drop at volume; and measurement confidence improves once you have a full pilot cycle behind you instead of partial-month data.
Operationalizing Fueling Savings: How Anytime Fuel Pros Fits Into ROI Programs
On-site fuel delivery changes several of the line items in your ROI model directly. When we bring fuel to equipment yards, job sites, and fleet depots, drivers and technicians stop making off-site fueling trips, which recovers the labor hours your baseline should already be tracking. Scheduled recurring deliveries also reduce the downtime that comes from vehicles or generators running dry mid-shift, a cost our downtime guide breaks down in more detail.
A few operational notes matter when you are feeding AFP data into your own ROI model:
- Scheduling reliability and transparent, itemized invoicing can give clean inputs for the “labor recovered” and “fuel spend” lines without manual reconciliation.
- Emergency response and response windows in covered markets can limit the downtime cost of an unplanned outage or an empty tank.
- Multi-site coordination through partner networks means fleets running across several states can model ROI under one vendor relationship instead of several fragmented ones.
Our mobile fleet fueling service page outlines the delivery mechanics in more depth for fleets evaluating this as a pilot component.
Strategies to Improve Fuel Purchasing Terms or Contract Negotiation to Enhance ROI
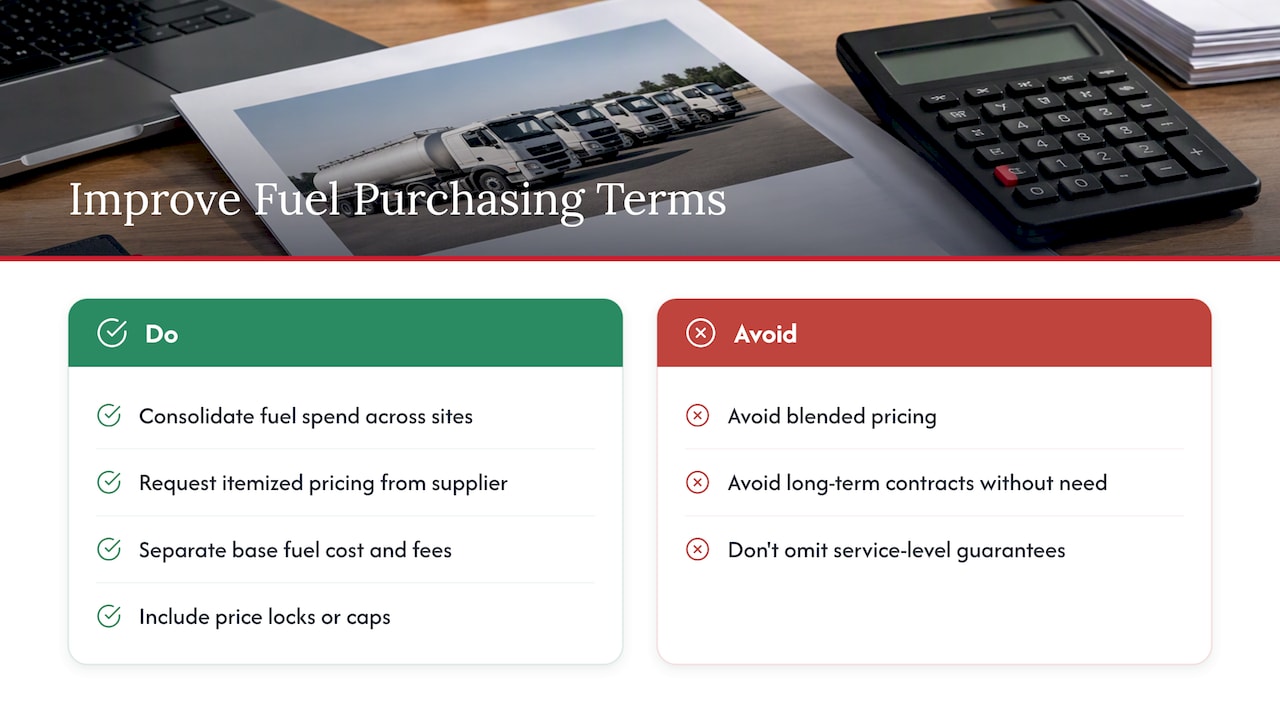
Purchasing terms move your ROI math as much as any operational lever, and they get far less attention. Volume commitments, even modest ones, typically unlock better per-gallon pricing, so consolidating fuel spend across sites or departments before negotiating gives you leverage you would not have buying in smaller, scattered batches.
Ask any fuel supplier for a transparent, itemized pricing structure rather than a blended rate. Blended pricing makes it hard to tell whether you are paying a fair market rate or absorbing a hidden delivery premium. Contracts that separate the base fuel cost from delivery fees, fuel tank rental, and any emergency-response surcharge let you compare vendors on equal terms and spot which line items are actually negotiable.
Price locks and fuel price caps can protect your ROI model from volatility, particularly useful when you have presented a payback period to leadership based on a specific fuel price assumption. Review contract length against your fleet’s own planning horizon: a one-year term gives you flexibility to renegotiate as fuel markets shift, while a multi-year term can lock in favorable pricing if you expect prices to rise.
Finally, build service-level commitments into the contract itself, not just the price. Guaranteed delivery windows and response times protect the labor and downtime savings your ROI model depends on just as much as the per-gallon rate does.
Impact of Fuel Quality and Supplier Reliability on ROI
Fuel quality affects ROI in ways that rarely show up until something breaks. Contaminated or degraded diesel causes filter clogging, injector wear, and in severe cases, engine damage, all of which show up as maintenance costs that erode whatever fuel savings your program produced. A supplier that does not test or maintain clean fuel storage is quietly working against your ROI model, even if their per-gallon price looks competitive.
Supplier reliability affects a different part of the calculation: labor and downtime. A missed delivery window forces a vehicle or a generator offline, and that lost productivity often costs more than the fuel itself. Fleets running mission-critical equipment, backup generators at a data center, for example, cannot treat delivery reliability as a secondary consideration.
Fuel polishing, which filters and removes water and contaminants from stored fuel, protects ROI for fleets running bulk tanks or backup generators that sit idle between uses. Our emergency fuel delivery and fuel polishing service addresses this directly for fleets with on-site storage.
When you model ROI, add a line for “quality and reliability risk” even if you cannot assign it a precise dollar figure yet. A single contamination incident or missed delivery can erase months of fuel-card and telematics savings, and factoring that risk into vendor selection protects the business case you built.
Regulatory and Compliance Considerations Affecting Fleet Fueling Costs and ROI
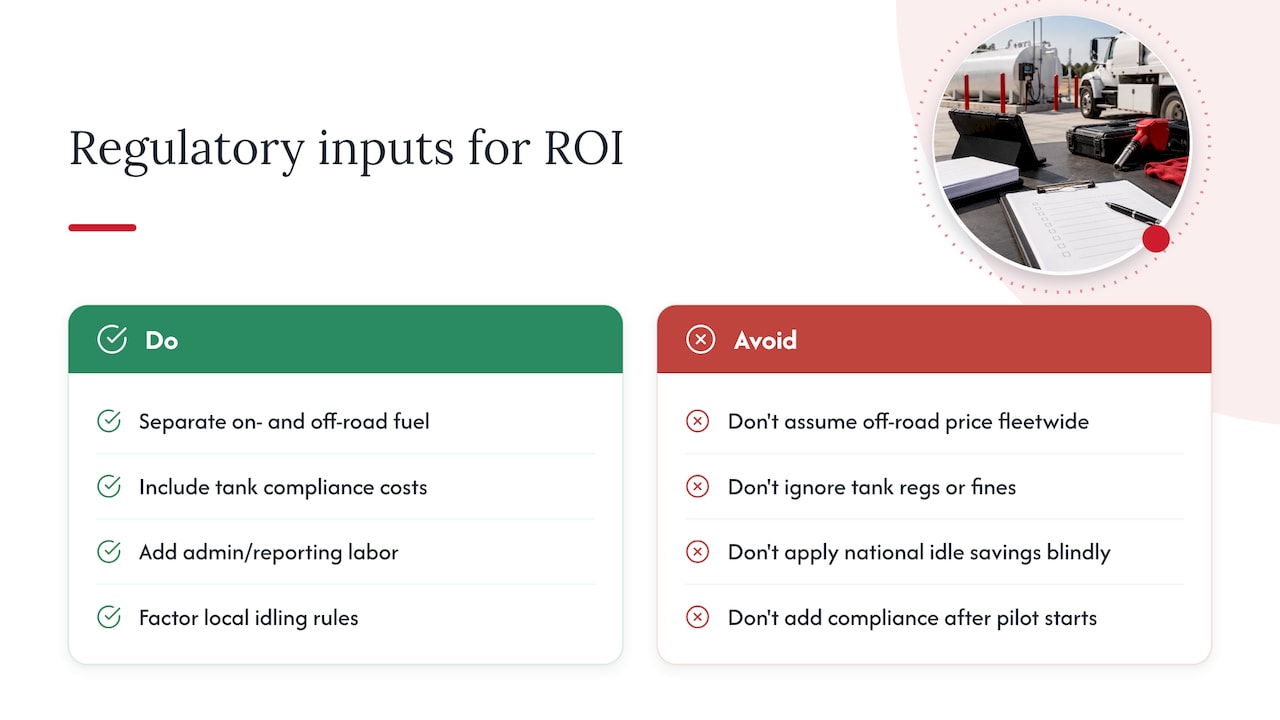
Dyed diesel, the red-dye off-road fuel used in construction, agriculture, and generator applications, carries tax advantages but also strict usage rules. Using dyed diesel in on-road vehicles is a compliance violation that can trigger significant penalties, so any ROI model that assumes off-road pricing for a mixed fleet needs a clear separation between on-road and off-road usage.
Fuel storage regulations also affect cost. Tanks above certain capacity thresholds require spill prevention plans and periodic inspections, and non-compliance can halt operations or trigger fines, both of which damage the labor and downtime assumptions in your ROI model. Municipal and government fleets face additional contract reporting requirements that can add administrative labor, a cost worth including in your baseline rather than treating it as a hidden extra.
Emissions and idling ordinances in some jurisdictions restrict how long a vehicle can idle, which changes the calculation for idle-reduction ROI: a fleet already under an idling restriction may see a smaller incremental benefit from APU installation than a fleet with no such limit. Factor local rules into your baseline before projecting idle-reduction savings from national averages.
None of these considerations should be treated as a reason to delay building your ROI model, but they belong in the inputs stage, not as an afterthought once a pilot is underway.
Request a Pilot Quote or ROI Template From Anytime Fuel Pros
Running the numbers above is the easy part. Proving them on your own fleet, with real delivery schedules and real downtime data, is where most ROI programs stall. We work with fleet managers to design pilot-ready on-site fueling programs, scheduled deliveries, bulk fills, and emergency response, that feed clean, attributable data straight into the model you just built.
If you are ready to test this against your own fleet, request a pilot quote or ask for our ROI input template through our fuel services page, and we will help you structure a pilot that holds up when you present it to your leadership team.
FAQ
Is a 4.5% ROI Considered Good for a Fleet Fueling Program?
A 4.5% return is modest compared to the ranges documented for fleet fueling programs, where fuel cards alone can produce payback in 2 to 3 months and layered programs often reach much higher returns over a few years.
What Is the Formula for Calculating Fleet Utilization Rate?
Fleet utilization rate is generally calculated as the number of vehicles actively in use divided by the total number of vehicles available, expressed as a percentage. Fleets often refine this further by measuring hours or miles driven against total available hours or miles, which gives a more precise picture than a simple vehicle count.
What Is Fleet Fuel Management?
Fleet fuel management is the practice of tracking, controlling, and optimizing fuel purchases, consumption, and efficiency across a group of vehicles or equipment. It typically combines fuel cards, telematics, and driver behavior programs to reduce waste, prevent theft, and lower total fuel spend.
What Is the Average Fleet MPG?
Average fleet MPG varies widely by vehicle class, duty cycle, and route type, so there is no single figure that applies across all fleets. NACFE’s fleet fuel study tracks MPG improvements over time across sample fleets and offers adoption benchmarks that are more useful than a single industry average for setting your own baseline.
Sources
- Alternative Fuels Data Center — Idle reduction research
- Heavy Duty Journal — Fleet fuel management systems ROI analysis
- Alternative Fuels Data Center — Efficient driving to conserve fuel
Recent Comments