
Which KPIs should you track in fuel delivery operations?
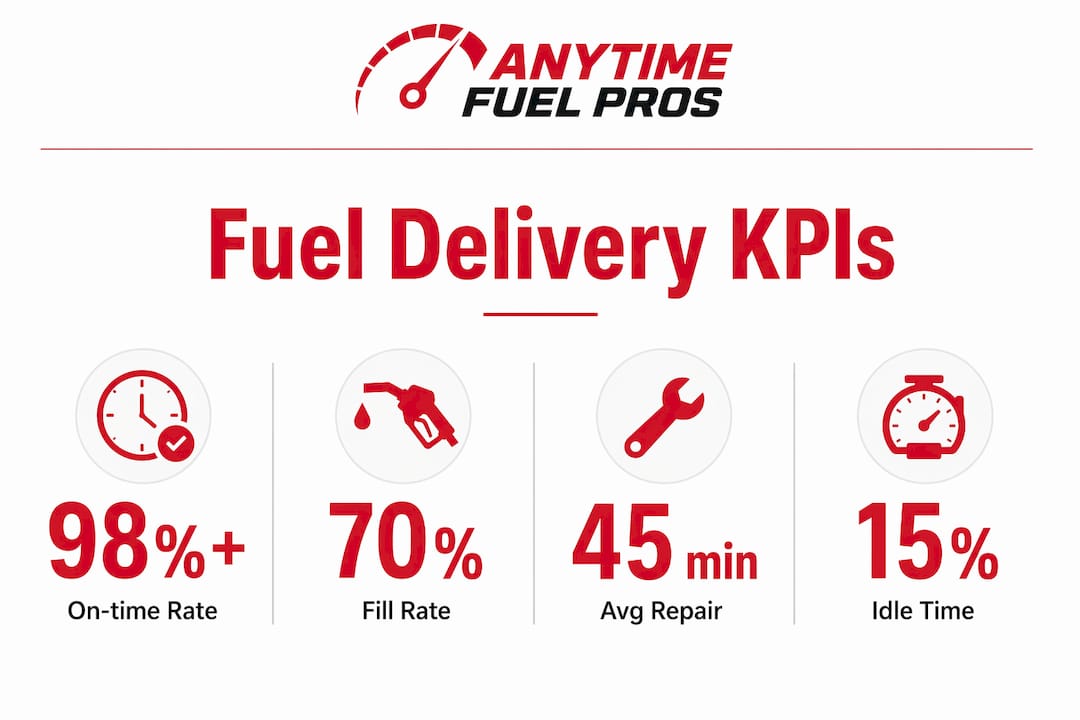
The metrics that move the needle in fuel delivery are on-time delivery rate, fill rate and tank monitoring, delivery efficiency, margin per delivery, safety incident rate, driver performance, and fuel consumption monitoring. These aren’t abstract scorecards. Each one ties directly to cost, uptime, and whether your customers stay or leave.
Here’s a quick-reference list of the core performance indicators and why each one belongs in your tracking program:
- On-time delivery rate: Measures the percentage of deliveries arriving within the scheduled window. On-time delivery directly correlates with customer retention and service reliability.
- Fill rate and tank monitoring: Tracks how much of a tank’s usable capacity you deliver per stop. Optimizing fills to approximately 70% of tank capacity balances safety stock against delivery frequency and labor cost.
- Delivery efficiency (gallons per hour): Quantifies how much fuel your drivers move per hour of work time, accounting for idling, unplanned stops, and route inefficiencies.
- Margin per delivery: Tracks the gross profit generated per stop, normalized across delivery types and business lines.
- Safety incident rate: Monitors accidents, near-misses, and compliance violations per delivery or work-hour block.
- Driver performance metrics: Covers idling time, route adherence, hard braking, and on-time execution at the individual driver level.
- Fuel consumption and waste monitoring: Flags excessive vehicle fuel burn, idling losses, and delivery variances between ordered and delivered volumes.
- Cost per gallon delivered: Rolls up driver wages, vehicle maintenance, fuel, and overhead into a per-unit cost figure.
- Customer retention rate: Measures the percentage of accounts that continue service over a defined period.
- Maintenance and fleet downtime percentage: Tracks unscheduled vehicle downtime as a share of total available fleet hours.
- Environmental impact metrics: Monitors carbon output, idle emissions, and compliance with EPA and state-level reporting requirements.
Anytimefuelpros applies this framework across its commercial operations in Texas, Utah, and through its national partner network, using integrated data to keep deliveries on schedule and costs in check.
How each KPI is measured and what it actually tells you
Understanding the formula behind a metric is the difference between tracking numbers and acting on them. The table below summarizes the core fuel delivery performance metrics, their measurement formulas, and practical benchmarks.
| KPI | Formula | Benchmark |
|---|---|---|
| On-time delivery rate | (On-time deliveries ÷ total deliveries) × 100 | Target a very high on-time delivery rate |
| Customer retention rate | (Customers at end of period ÷ customers at start) × 100 | Target a low annual customer churn rate |
| Fill rate (tank efficiency) | Gallons delivered ÷ usable tank capacity | Target ~70% of capacity |
| Gallons per hour | Total gallons delivered ÷ total hours on route | Higher = more efficient |
| Margin per delivery | Total margin ÷ number of deliveries | Benchmark to your own historical data |
| Cost per delivery | Total operational costs ÷ number of deliveries | Industry range: moderate to high cost per delivery |
| Fleet downtime percentage | (Unscheduled downtime hours ÷ total available hours) × 100 | Target under 5% |
| Safety incident rate | Incidents ÷ total deliveries or work hours | Target as close to zero as possible |
On-time delivery rate and customer retention are the two service quality metrics that most directly affect revenue. A 5% improvement in customer retention can increase profitability by 25%–95%, which means a single percentage point of on-time performance has real financial weight. Achieving a very high on-time delivery rate is the threshold where churn drops meaningfully.
Gallons per hour is a more honest efficiency measure than gallons per mile alone. It captures the “meandering factor,” meaning time a driver spends idling in the yard, taking unplanned breaks, or waiting at a customer site. Two drivers covering the same route can show identical gallons-per-mile numbers while one is burning an extra 90 minutes per shift in non-productive time.
Margin per delivery works best when you normalize it across delivery types. As the industry standard framing goes, the question is how much of every dollar of gross profit actually drops to the bottom line, whether you’re measuring operating profit, net income, or EBITDA. Tracking net income as a percentage of gross profit lets you compare performance across routes, product lines, and customer segments without distortion.
Fill rate optimization has an outsized impact on labor costs. When you consistently deliver at roughly 70% of tank capacity, you reduce delivery frequency without risking runouts. The math is direct: Reducing the frequency of servicing a tank can save significant annual costs per tank given the average stop cost.
Pro Tip: Don’t track gallons per mile in isolation for rural routes. A driver covering sparse territory will always score lower than one working a dense suburban corridor. Normalize by geography before drawing performance conclusions, or you’ll penalize your best rural operators.
Why KPI data collection is harder than it looks
The biggest obstacle in fuel delivery KPI tracking isn’t choosing the right metrics. It’s getting clean, integrated data that actually reflects what happened on the route.
Most operations run into three recurring problems:
- Data accessibility gaps: Knowing the tank sizes at every delivery location sounds basic, but for many distributors it’s a manual, time-consuming process. Without accurate tank capacity data, fill rate calculations are guesswork.
- Tank monitor integration failures: Dispatchers at larger operations can receive hundreds of tank monitor alerts daily. Without automation connecting those monitors to a dispatch system, automated order creation never happens, and dispatchers spend their day triaging emails instead of managing routes.
- Legacy routing patterns: Routes built years ago often haven’t been updated to reflect new customer locations, road changes, or tank monitor data. Drivers follow habit, not optimization.
Technology closes most of these gaps. Live dashboards that pull telematics, GPS, and financial data into a single view let operations managers spot deviations in real time rather than discovering them in a weekly report. Combining telematics with cost-to-serve data reveals which routes and customers are actually profitable, not just which ones look busy on a map.
Exception reporting is particularly powerful for route auditing. Comparing actual versus projected route times uncovers systematic issues, from unauthorized stops to routing habits that have calcified over years. One documented case involved a driver making regular hour-long restaurant stops that only surfaced when route timing analysis flagged the deviation. Manual GPS review confirmed it within minutes.
Data normalization matters just as much as data collection. A gallons-per-mile KPI that doesn’t account for geographic density will consistently make rural drivers look inefficient compared to urban ones. Before you act on a metric, confirm that the comparison is apples to apples.
Pro Tip: Tracking too many KPIs creates its own problem. Focusing on a limited, functional KPI set prevents dysfunctional employee behavior and keeps improvement goals clear. Start with one or two metrics per functional area, establish a baseline, and add complexity only after you’ve built reliable data pipelines.
How Anytimefuelpros applies KPI tracking in the field
“It’s just astonishing, especially in the context of how difficult it is to recruit, train, onboard drivers and maintain that driver base when you realize you don’t even need a third or half of your driver base.” — Industry operations expert on the impact of fill rate optimization, via FleetPanda
Anytimefuelpros operates in some of the most demanding fuel delivery environments in the country, including data centers in Dallas that cannot tolerate generator fuel gaps, mining sites in Utah with no margin for equipment downtime, and construction fleets across Texas that need fuel on-site before the first shift starts. That operational reality makes KPI tracking a daily discipline, not a quarterly review.
The practical approach starts with fill rate. By building delivery schedules around tank monitor data rather than fixed calendar intervals, Anytimefuelpros reduces unnecessary stops and keeps driver capacity focused on accounts that actually need fuel. The goal is to get to a point where dispatch isn’t reacting to a thousand daily alerts but instead working from an automated queue that surfaces only the orders that need attention.
Route efficiency gets measured at the location level. Delivery efficiency at a given customer site should be consistent once a driver has completed several visits. If one driver achieves 500 gallons per hour at a site and another is running at 100, that gap points to a specific, fixable problem, whether it’s equipment handling, site familiarity, or time management. Anytimefuelpros uses route optimization data to close those gaps systematically rather than attributing them to individual driver variation.

Fuel delivery analytics also serve as an early warning system for fleet downtime costs. When telematics flags a vehicle running outside normal parameters, the maintenance team can schedule service before a breakdown pulls a truck off the road during a peak delivery window. That proactive posture is what keeps fleet downtime below the 5% threshold that industry best practice sets as the ceiling for well-managed operations.
How fleet maintenance tracking protects your delivery capacity
Fleet downtime is one of the most direct ways a fuel delivery operation loses money without seeing it on a single invoice. When a truck is out of service, every delivery it was scheduled to make either gets delayed, reassigned to an already-loaded driver, or missed entirely.
The industry benchmark aims for a low percentage of unscheduled fleet downtime relative to total available vehicle hours. Exceeding that threshold doesn’t just affect capacity; it compresses margins on every delivery the remaining fleet has to absorb. A proactive maintenance schedule, built around mileage intervals, engine hours, and telematics alerts, is what separates operations that stay under that ceiling from those that don’t.
Tracking maintenance KPIs means logging scheduled versus unscheduled repairs, average repair turnaround time, and cost per repair event. When you see a cluster of unscheduled repairs on a specific vehicle or a specific route, that pattern points to either a mechanical issue or a driver behavior problem, both of which are fixable once the data surfaces them. Fleet insurance analytics can further reduce costs by identifying risk patterns before they become claims.
What environmental metrics tell you about operational efficiency
Environmental impact metrics in fuel delivery aren’t just a compliance checkbox. They’re a direct proxy for operational waste.

Idle time is the clearest example. Every hour a diesel truck idles at a customer site or in a staging yard burns fuel, generates emissions, and adds wear to the engine without moving a single gallon toward a customer. Tracking idle time per driver and per route reveals waste that GPS alone won’t show. Operations that monitor idle emissions alongside delivery efficiency consistently find that the drivers with the worst idle numbers also score lowest on gallons-per-hour metrics.
Carbon output per gallon delivered is becoming a standard reporting metric for enterprise customers, particularly in sectors like data centers and municipal fleets where sustainability reporting is part of vendor qualification. Tracking it now, before customers require it, puts your operation ahead of the curve. Tools like OBD-II telematics systems and fleet management platforms can calculate CO2 output per route using engine data and fuel consumption logs.
Regulatory compliance adds another layer. EPA Tier 4 emissions standards apply to off-road diesel equipment, and state-level requirements in Texas and Utah carry their own reporting obligations. Monitoring compliance metrics, including DEF consumption rates for Tier 4 engines, keeps your operation out of penalty territory and gives customers the documentation they need for their own audits. Anytimefuelpros includes DEF delivery as part of its standard service offering precisely because compliance tracking and fuel delivery belong in the same operational workflow.
Commercial vehicle risk management also intersects with environmental metrics. Vehicles that idle excessively or operate outside normal parameters carry higher accident and mechanical risk, which shows up in both safety incident rates and insurance costs.
Key Takeaways
Effective fuel delivery KPI tracking ties operational data directly to cost control, customer retention, and fleet reliability across every route you run.
| Point | Details |
|---|---|
| On-time delivery drives retention | Achieving 98%+ on-time delivery reduces churn; a 5% retention gain can increase profitability by 25%–95%. |
| Fill rate optimization cuts labor costs | Targeting ~70% of tank capacity per stop reduces delivery frequency and can save $1,000 per tank annually. |
| Gallons per hour beats gallons per mile | This metric captures idle time and unplanned stops, giving a more accurate picture of true route efficiency. |
| Fleet downtime must stay under 5% | Unscheduled downtime above 5% of available hours compresses margins and disrupts delivery capacity. |
| Limit your KPI set | Tracking too many metrics drives dysfunctional behavior; start with one or two per functional area and build from there. |
Ready to put these metrics to work? Anytimefuelpros delivers fuel to job sites, data centers, mining operations, and commercial fleets across Texas, Utah, and nationwide, with the operational infrastructure to support transparent, data-driven delivery programs. Get your fuel delivery questions answered or explore on-demand diesel delivery services built for operations that can’t afford downtime.
Recent Comments